
UTS#
Data Understanding#
%pip install ucimlrepo
Requirement already satisfied: ucimlrepo in /home/codespace/.python/current/lib/python3.12/site-packages (0.0.7)
Requirement already satisfied: pandas>=1.0.0 in /home/codespace/.local/lib/python3.12/site-packages (from ucimlrepo) (2.2.3)
Requirement already satisfied: certifi>=2020.12.5 in /home/codespace/.local/lib/python3.12/site-packages (from ucimlrepo) (2024.8.30)
Requirement already satisfied: numpy>=1.26.0 in /home/codespace/.python/current/lib/python3.12/site-packages (from pandas>=1.0.0->ucimlrepo) (1.26.4)
Requirement already satisfied: python-dateutil>=2.8.2 in /home/codespace/.local/lib/python3.12/site-packages (from pandas>=1.0.0->ucimlrepo) (2.9.0.post0)
Requirement already satisfied: pytz>=2020.1 in /home/codespace/.local/lib/python3.12/site-packages (from pandas>=1.0.0->ucimlrepo) (2024.2)
Requirement already satisfied: tzdata>=2022.7 in /home/codespace/.local/lib/python3.12/site-packages (from pandas>=1.0.0->ucimlrepo) (2024.2)
Requirement already satisfied: six>=1.5 in /home/codespace/.local/lib/python3.12/site-packages (from python-dateutil>=2.8.2->pandas>=1.0.0->ucimlrepo) (1.17.0)
Note: you may need to restart the kernel to use updated packages.
from ucimlrepo import fetch_ucirepo
# fetch dataset
cirrhosis_patient_survival_prediction = fetch_ucirepo(id=878)
# data (as pandas dataframes)
X = cirrhosis_patient_survival_prediction.data.features
y = cirrhosis_patient_survival_prediction.data.targets
# metadata
print(cirrhosis_patient_survival_prediction.metadata)
# variable information
print(cirrhosis_patient_survival_prediction.variables)
{'uci_id': 878, 'name': 'Cirrhosis Patient Survival Prediction', 'repository_url': 'https://archive.ics.uci.edu/dataset/878/cirrhosis+patient+survival+prediction+dataset-1', 'data_url': 'https://archive.ics.uci.edu/static/public/878/data.csv', 'abstract': 'Utilize 17 clinical features for predicting survival state of patients with liver cirrhosis. The survival states include 0 = D (death), 1 = C (censored), 2 = CL (censored due to liver transplantation).', 'area': 'Health and Medicine', 'tasks': ['Classification'], 'characteristics': ['Tabular'], 'num_instances': 418, 'num_features': 17, 'feature_types': ['Real', 'Categorical'], 'demographics': ['Age', 'Sex'], 'target_col': ['Status'], 'index_col': ['ID'], 'has_missing_values': 'yes', 'missing_values_symbol': 'NaN', 'year_of_dataset_creation': 1989, 'last_updated': 'Fri Nov 03 2023', 'dataset_doi': '10.24432/C5R02G', 'creators': ['E. Dickson', 'P. Grambsch', 'T. Fleming', 'L. Fisher', 'A. Langworthy'], 'intro_paper': {'ID': 296, 'type': 'NATIVE', 'title': 'Prognosis in primary biliary cirrhosis: Model for decision making', 'authors': 'E. Dickson, P. Grambsch, T. Fleming, L. Fisher, A. Langworthy', 'venue': 'Hepatology', 'year': 1989, 'journal': None, 'DOI': None, 'URL': 'https://www.semanticscholar.org/paper/db1487216b8a4b26f5e5078ea9109ac9d8355b65', 'sha': None, 'corpus': None, 'arxiv': None, 'mag': None, 'acl': None, 'pmid': None, 'pmcid': None}, 'additional_info': {'summary': "During 1974 to 1984, 424 PBC patients referred to the Mayo Clinic qualified for the randomized placebo-controlled trial testing the drug D-penicillamine. Of these, the initial 312 patients took part in the trial and have mostly comprehensive data. The remaining 112 patients didn't join the clinical trial but agreed to record basic metrics and undergo survival tracking. Six of these patients were soon untraceable after their diagnosis, leaving data for 106 of these individuals in addition to the 312 who were part of the randomized trial.", 'purpose': 'Cirrhosis results from prolonged liver damage, leading to extensive scarring, often due to conditions like hepatitis or chronic alcohol consumption. The data provided is sourced from a Mayo Clinic study on primary biliary cirrhosis (PBC) of the liver carried out from 1974 to 1984.', 'funded_by': 'Mayo Clinic', 'instances_represent': 'People', 'recommended_data_splits': None, 'sensitive_data': 'Gender, Age', 'preprocessing_description': '1. Drop all the rows where miss value (NA) were present in the Drug column\n2. Impute missing values with mean results\n3. One-hot encoding for all category attributes', 'variable_info': '1. ID: unique identifier\n2. N_Days: number of days between registration and the earlier of death, transplantation, or study analysis time in July 1986\n3. Status: status of the patient C (censored), CL (censored due to liver tx), or D (death)\n4. Drug: type of drug D-penicillamine or placebo\n5. Age: age in [days]\n6. Sex: M (male) or F (female)\n7. Ascites: presence of ascites N (No) or Y (Yes)\n8. Hepatomegaly: presence of hepatomegaly N (No) or Y (Yes)\n9. Spiders: presence of spiders N (No) or Y (Yes)\n10. Edema: presence of edema N (no edema and no diuretic therapy for edema), S (edema present without diuretics, or edema resolved by diuretics), or Y (edema despite diuretic therapy)\n11. Bilirubin: serum bilirubin in [mg/dl]\n12. Cholesterol: serum cholesterol in [mg/dl]\n13. Albumin: albumin in [gm/dl]\n14. Copper: urine copper in [ug/day]\n15. Alk_Phos: alkaline phosphatase in [U/liter]\n16. SGOT: SGOT in [U/ml]\n17. Triglycerides: triglicerides in [mg/dl]\n18. Platelets: platelets per cubic [ml/1000]\n19. Prothrombin: prothrombin time in seconds [s]\n20. Stage: histologic stage of disease (1, 2, 3, or 4)\n', 'citation': 'Fleming, Thomas R., and David P. Harrington. Counting processes and survival analysis. Vol. 625. John Wiley & Sons, 2013.'}}
name role type demographic \
0 ID ID Integer None
1 N_Days Other Integer None
2 Status Target Categorical None
3 Drug Feature Categorical None
4 Age Feature Integer Age
5 Sex Feature Categorical Sex
6 Ascites Feature Categorical None
7 Hepatomegaly Feature Categorical None
8 Spiders Feature Categorical None
9 Edema Feature Categorical None
10 Bilirubin Feature Continuous None
11 Cholesterol Feature Integer None
12 Albumin Feature Continuous None
13 Copper Feature Integer None
14 Alk_Phos Feature Continuous None
15 SGOT Feature Continuous None
16 Tryglicerides Feature Integer None
17 Platelets Feature Integer None
18 Prothrombin Feature Continuous None
19 Stage Feature Categorical None
description units missing_values
0 unique identifier None no
1 number of days between registration and the ea... None no
2 status of the patient C (censored), CL (censor... None no
3 type of drug D-penicillamine or placebo None yes
4 age days no
5 M (male) or F (female) None no
6 presence of ascites N (No) or Y (Yes) None yes
7 presence of hepatomegaly N (No) or Y (Yes) None yes
8 presence of spiders N (No) or Y (Yes) None yes
9 presence of edema N (no edema and no diuretic ... None no
10 serum bilirubin mg/dl no
11 serum cholesterol mg/dl yes
12 albumin gm/dl no
13 urine copper ug/day yes
14 alkaline phosphatase U/liter yes
15 SGOT U/ml yes
16 tryglicerides None yes
17 platelets per cubic ml/1000 yes
18 prothrombin time s yes
19 histologic stage of disease (1, 2, 3, or 4) None yes
Eksplorasi Data#
import pandas as pd
# Baca file CSV
df = pd.read_csv("data.csv")
# Tampilkan kolom kategorikal
categorical_columns = df.select_dtypes(include=['object', 'category']).columns
print("Kolom kategorikal:")
print(categorical_columns.tolist())
print("\n")
# Hapus kolom 'id' dari analisis statistik deskriptif jika ada
if 'id' in df.columns:
df_numeric = df.select_dtypes(include=['number']).drop(columns=['id'])
else:
df_numeric = df.select_dtypes(include=['number'])
# Hitung statistik deskriptif yang diminta
stats = pd.DataFrame({
"Mean": df_numeric.mean(),
"Median": df_numeric.median(),
"Mode": df_numeric.mode().iloc[0], # Mode bisa lebih dari satu nilai, ambil yang pertama
"Std Dev": df_numeric.std(ddof=0), # Standar deviasi populasi (ddof=0)
"Min": df_numeric.min(),
"Max": df_numeric.max(),
"Missing": df_numeric.isnull().sum()
})
# Tampilkan hasil
print(stats)
print("\n")
print(df.info())
Kolom kategorikal:
['Status', 'Drug', 'Sex', 'Ascites', 'Hepatomegaly', 'Spiders', 'Edema']
Mean Median Mode Std Dev Min \
ID 209.500000 209.50 1.00 120.665861 1.00
N_Days 1917.782297 1730.00 41.00 1103.350822 41.00
Age 18533.351675 18628.00 19724.00 3811.277913 9598.00
Bilirubin 3.220813 1.40 0.70 4.402231 0.30
Cholesterol 369.510563 309.50 260.00 231.535832 120.00
Albumin 3.497440 3.53 3.35 0.424463 1.96
Copper 97.648387 73.00 52.00 85.475721 4.00
Alk_Phos 1982.655769 1259.00 559.00 2136.955961 289.00
SGOT 122.556346 114.70 71.30 56.608587 26.35
Tryglicerides 124.702128 108.00 118.00 65.033024 33.00
Platelets 257.024570 251.00 344.00 98.204717 62.00
Prothrombin 10.731731 10.60 10.60 1.020771 9.00
Stage 3.024272 3.00 3.00 0.880971 1.00
Max Missing
ID 418.00 0
N_Days 4795.00 0
Age 28650.00 0
Bilirubin 28.00 0
Cholesterol 1775.00 134
Albumin 4.64 0
Copper 588.00 108
Alk_Phos 13862.40 106
SGOT 457.25 106
Tryglicerides 598.00 136
Platelets 721.00 11
Prothrombin 18.00 2
Stage 4.00 6
<class 'pandas.core.frame.DataFrame'>
RangeIndex: 418 entries, 0 to 417
Data columns (total 20 columns):
# Column Non-Null Count Dtype
--- ------ -------------- -----
0 ID 418 non-null int64
1 N_Days 418 non-null int64
2 Status 418 non-null object
3 Drug 312 non-null object
4 Age 418 non-null int64
5 Sex 418 non-null object
6 Ascites 312 non-null object
7 Hepatomegaly 312 non-null object
8 Spiders 312 non-null object
9 Edema 418 non-null object
10 Bilirubin 418 non-null float64
11 Cholesterol 284 non-null float64
12 Albumin 418 non-null float64
13 Copper 310 non-null float64
14 Alk_Phos 312 non-null float64
15 SGOT 312 non-null float64
16 Tryglicerides 282 non-null float64
17 Platelets 407 non-null float64
18 Prothrombin 416 non-null float64
19 Stage 412 non-null float64
dtypes: float64(10), int64(3), object(7)
memory usage: 65.4+ KB
None
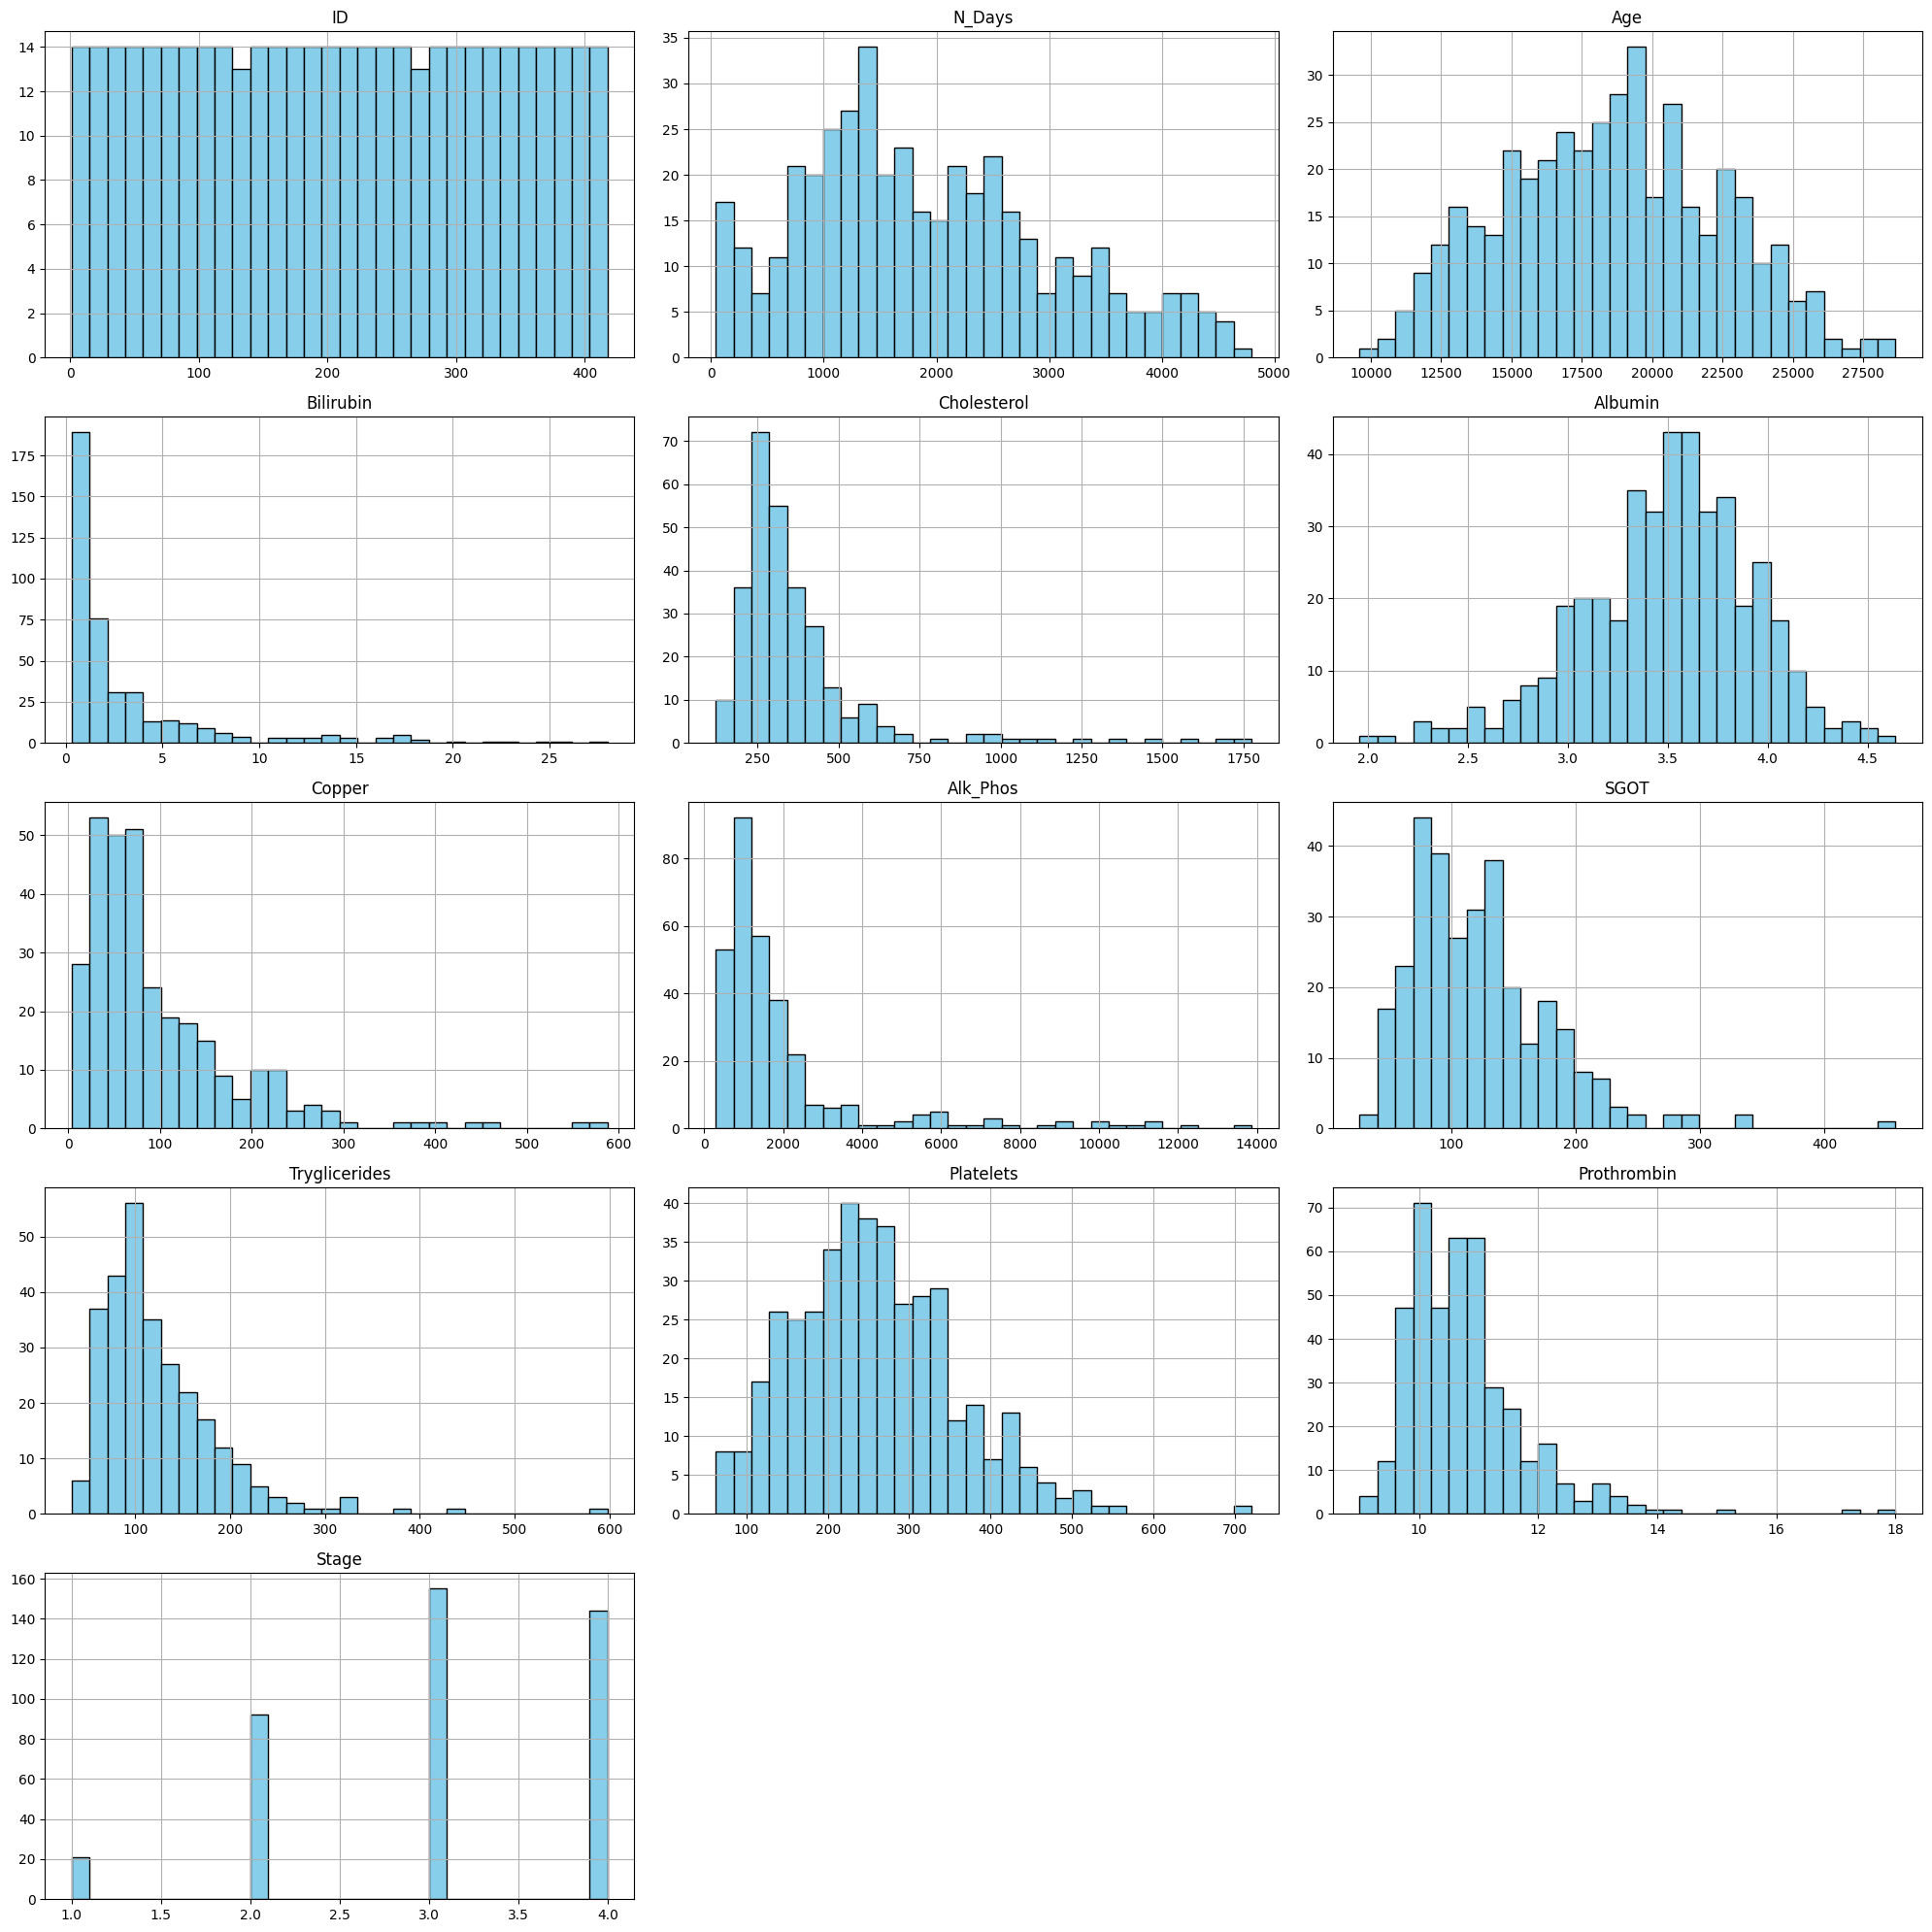
Visualisasi Data Histogram : untuk melihat distribusi data numerik.#
import matplotlib.pyplot as plt
# Memilih hanya kolom numerik
numeric_columns = df.select_dtypes(include=['number']).columns
# Membuat histogram untuk setiap kolom numerik
plt.figure(figsize=(20, 20))
for i, col in enumerate(numeric_columns, 1):
plt.subplot(len(numeric_columns) // 3 + 1, 3, i)
df[col].hist(bins=30, color='skyblue', edgecolor='black')
plt.title(col)
plt.tight_layout()
plt.show()
Profiling data#
%pip install ydata-profiling
%pip install ipywidgets
Requirement already satisfied: ydata-profiling in /home/codespace/.python/current/lib/python3.12/site-packages (4.12.2)
Requirement already satisfied: scipy<1.16,>=1.4.1 in /home/codespace/.local/lib/python3.12/site-packages (from ydata-profiling) (1.14.1)
Requirement already satisfied: pandas!=1.4.0,<3,>1.1 in /home/codespace/.local/lib/python3.12/site-packages (from ydata-profiling) (2.2.3)
Requirement already satisfied: matplotlib>=3.5 in /home/codespace/.python/current/lib/python3.12/site-packages (from ydata-profiling) (3.10.3)
Requirement already satisfied: pydantic>=2 in /home/codespace/.python/current/lib/python3.12/site-packages (from ydata-profiling) (2.10.6)
Requirement already satisfied: PyYAML<6.1,>=5.0.0 in /home/codespace/.local/lib/python3.12/site-packages (from ydata-profiling) (6.0.2)
Requirement already satisfied: jinja2<3.2,>=2.11.1 in /home/codespace/.local/lib/python3.12/site-packages (from ydata-profiling) (3.1.4)
Requirement already satisfied: visions<0.8.0,>=0.7.5 in /home/codespace/.python/current/lib/python3.12/site-packages (from visions[type_image_path]<0.8.0,>=0.7.5->ydata-profiling) (0.7.6)
Requirement already satisfied: numpy<2.2,>=1.16.0 in /home/codespace/.python/current/lib/python3.12/site-packages (from ydata-profiling) (1.26.4)
Requirement already satisfied: htmlmin==0.1.12 in /home/codespace/.python/current/lib/python3.12/site-packages (from ydata-profiling) (0.1.12)
Requirement already satisfied: phik<0.13,>=0.11.1 in /home/codespace/.python/current/lib/python3.12/site-packages (from ydata-profiling) (0.12.4)
Requirement already satisfied: requests<3,>=2.24.0 in /home/codespace/.local/lib/python3.12/site-packages (from ydata-profiling) (2.32.3)
Requirement already satisfied: tqdm<5,>=4.48.2 in /home/codespace/.python/current/lib/python3.12/site-packages (from ydata-profiling) (4.67.1)
Requirement already satisfied: seaborn<0.14,>=0.10.1 in /home/codespace/.local/lib/python3.12/site-packages (from ydata-profiling) (0.13.2)
Requirement already satisfied: multimethod<2,>=1.4 in /home/codespace/.python/current/lib/python3.12/site-packages (from ydata-profiling) (1.12)
Requirement already satisfied: statsmodels<1,>=0.13.2 in /home/codespace/.python/current/lib/python3.12/site-packages (from ydata-profiling) (0.14.4)
Requirement already satisfied: typeguard<5,>=3 in /home/codespace/.python/current/lib/python3.12/site-packages (from ydata-profiling) (4.4.2)
Requirement already satisfied: imagehash==4.3.1 in /home/codespace/.python/current/lib/python3.12/site-packages (from ydata-profiling) (4.3.1)
Requirement already satisfied: wordcloud>=1.9.3 in /home/codespace/.python/current/lib/python3.12/site-packages (from ydata-profiling) (1.9.4)
Requirement already satisfied: dacite>=1.8 in /home/codespace/.python/current/lib/python3.12/site-packages (from ydata-profiling) (1.9.2)
Requirement already satisfied: PyWavelets in /home/codespace/.python/current/lib/python3.12/site-packages (from imagehash==4.3.1->ydata-profiling) (1.8.0)
Requirement already satisfied: pillow in /home/codespace/.local/lib/python3.12/site-packages (from imagehash==4.3.1->ydata-profiling) (11.0.0)
Requirement already satisfied: MarkupSafe>=2.0 in /home/codespace/.local/lib/python3.12/site-packages (from jinja2<3.2,>=2.11.1->ydata-profiling) (3.0.2)
Requirement already satisfied: python-dateutil>=2.8.2 in /home/codespace/.local/lib/python3.12/site-packages (from pandas!=1.4.0,<3,>1.1->ydata-profiling) (2.9.0.post0)
Requirement already satisfied: pytz>=2020.1 in /home/codespace/.local/lib/python3.12/site-packages (from pandas!=1.4.0,<3,>1.1->ydata-profiling) (2024.2)
Requirement already satisfied: tzdata>=2022.7 in /home/codespace/.local/lib/python3.12/site-packages (from pandas!=1.4.0,<3,>1.1->ydata-profiling) (2024.2)
Requirement already satisfied: joblib>=0.14.1 in /home/codespace/.local/lib/python3.12/site-packages (from phik<0.13,>=0.11.1->ydata-profiling) (1.4.2)
Requirement already satisfied: charset-normalizer<4,>=2 in /home/codespace/.local/lib/python3.12/site-packages (from requests<3,>=2.24.0->ydata-profiling) (3.4.0)
Requirement already satisfied: idna<4,>=2.5 in /home/codespace/.local/lib/python3.12/site-packages (from requests<3,>=2.24.0->ydata-profiling) (3.10)
Requirement already satisfied: urllib3<3,>=1.21.1 in /home/codespace/.local/lib/python3.12/site-packages (from requests<3,>=2.24.0->ydata-profiling) (2.2.3)
Requirement already satisfied: certifi>=2017.4.17 in /home/codespace/.local/lib/python3.12/site-packages (from requests<3,>=2.24.0->ydata-profiling) (2024.8.30)
Requirement already satisfied: patsy>=0.5.6 in /home/codespace/.python/current/lib/python3.12/site-packages (from statsmodels<1,>=0.13.2->ydata-profiling) (1.0.1)
Requirement already satisfied: packaging>=21.3 in /home/codespace/.local/lib/python3.12/site-packages (from statsmodels<1,>=0.13.2->ydata-profiling) (24.2)
Requirement already satisfied: typing_extensions>=4.10.0 in /home/codespace/.local/lib/python3.12/site-packages (from typeguard<5,>=3->ydata-profiling) (4.12.2)
Requirement already satisfied: attrs>=19.3.0 in /home/codespace/.local/lib/python3.12/site-packages (from visions<0.8.0,>=0.7.5->visions[type_image_path]<0.8.0,>=0.7.5->ydata-profiling) (24.2.0)
Requirement already satisfied: networkx>=2.4 in /home/codespace/.local/lib/python3.12/site-packages (from visions<0.8.0,>=0.7.5->visions[type_image_path]<0.8.0,>=0.7.5->ydata-profiling) (3.2.1)
Requirement already satisfied: contourpy>=1.0.1 in /home/codespace/.local/lib/python3.12/site-packages (from matplotlib>=3.5->ydata-profiling) (1.3.1)
Requirement already satisfied: cycler>=0.10 in /home/codespace/.local/lib/python3.12/site-packages (from matplotlib>=3.5->ydata-profiling) (0.12.1)
Requirement already satisfied: fonttools>=4.22.0 in /home/codespace/.local/lib/python3.12/site-packages (from matplotlib>=3.5->ydata-profiling) (4.55.3)
Requirement already satisfied: kiwisolver>=1.3.1 in /home/codespace/.local/lib/python3.12/site-packages (from matplotlib>=3.5->ydata-profiling) (1.4.7)
Requirement already satisfied: pyparsing>=2.3.1 in /home/codespace/.local/lib/python3.12/site-packages (from matplotlib>=3.5->ydata-profiling) (3.2.0)
Requirement already satisfied: annotated-types>=0.6.0 in /home/codespace/.python/current/lib/python3.12/site-packages (from pydantic>=2->ydata-profiling) (0.7.0)
Requirement already satisfied: pydantic-core==2.27.2 in /home/codespace/.python/current/lib/python3.12/site-packages (from pydantic>=2->ydata-profiling) (2.27.2)
Requirement already satisfied: six>=1.5 in /home/codespace/.local/lib/python3.12/site-packages (from python-dateutil>=2.8.2->pandas!=1.4.0,<3,>1.1->ydata-profiling) (1.17.0)
Note: you may need to restart the kernel to use updated packages.
Requirement already satisfied: ipywidgets in /home/codespace/.python/current/lib/python3.12/site-packages (8.1.5)
Requirement already satisfied: comm>=0.1.3 in /home/codespace/.local/lib/python3.12/site-packages (from ipywidgets) (0.2.2)
Requirement already satisfied: ipython>=6.1.0 in /home/codespace/.local/lib/python3.12/site-packages (from ipywidgets) (8.30.0)
Requirement already satisfied: traitlets>=4.3.1 in /home/codespace/.local/lib/python3.12/site-packages (from ipywidgets) (5.14.3)
Requirement already satisfied: widgetsnbextension~=4.0.12 in /home/codespace/.python/current/lib/python3.12/site-packages (from ipywidgets) (4.0.13)
Requirement already satisfied: jupyterlab-widgets~=3.0.12 in /home/codespace/.python/current/lib/python3.12/site-packages (from ipywidgets) (3.0.13)
Requirement already satisfied: decorator in /home/codespace/.local/lib/python3.12/site-packages (from ipython>=6.1.0->ipywidgets) (5.1.1)
Requirement already satisfied: jedi>=0.16 in /home/codespace/.local/lib/python3.12/site-packages (from ipython>=6.1.0->ipywidgets) (0.19.2)
Requirement already satisfied: matplotlib-inline in /home/codespace/.local/lib/python3.12/site-packages (from ipython>=6.1.0->ipywidgets) (0.1.7)
Requirement already satisfied: pexpect>4.3 in /home/codespace/.local/lib/python3.12/site-packages (from ipython>=6.1.0->ipywidgets) (4.9.0)
Requirement already satisfied: prompt_toolkit<3.1.0,>=3.0.41 in /home/codespace/.local/lib/python3.12/site-packages (from ipython>=6.1.0->ipywidgets) (3.0.48)
Requirement already satisfied: pygments>=2.4.0 in /home/codespace/.local/lib/python3.12/site-packages (from ipython>=6.1.0->ipywidgets) (2.18.0)
Requirement already satisfied: stack_data in /home/codespace/.local/lib/python3.12/site-packages (from ipython>=6.1.0->ipywidgets) (0.6.3)
Requirement already satisfied: wcwidth in /home/codespace/.local/lib/python3.12/site-packages (from prompt_toolkit<3.1.0,>=3.0.41->ipython>=6.1.0->ipywidgets) (0.2.13)
Requirement already satisfied: parso<0.9.0,>=0.8.4 in /home/codespace/.local/lib/python3.12/site-packages (from jedi>=0.16->ipython>=6.1.0->ipywidgets) (0.8.4)
Requirement already satisfied: ptyprocess>=0.5 in /home/codespace/.local/lib/python3.12/site-packages (from pexpect>4.3->ipython>=6.1.0->ipywidgets) (0.7.0)
Requirement already satisfied: executing>=1.2.0 in /home/codespace/.local/lib/python3.12/site-packages (from stack_data->ipython>=6.1.0->ipywidgets) (2.1.0)
Requirement already satisfied: asttokens>=2.1.0 in /home/codespace/.local/lib/python3.12/site-packages (from stack_data->ipython>=6.1.0->ipywidgets) (3.0.0)
Requirement already satisfied: pure-eval in /home/codespace/.local/lib/python3.12/site-packages (from stack_data->ipython>=6.1.0->ipywidgets) (0.2.3)
Note: you may need to restart the kernel to use updated packages.
import pandas as pd
from ydata_profiling import ProfileReport
#baca dataset
df = pd.read_csv("data.csv")
#laporan profiling
profile = ProfileReport(df, explorative = True)
# Simpan laporan ke file HTML
profile.to_file("data.html")
# Tampilkan di notebook (opsional)
profile.to_notebook_iframe()
Menghapus Nilai NUll#
import pandas as pd
# Baca file
df = pd.read_csv("data.csv")
# Hapus semua baris yang mengandung nilai null
df_cleaned = df.dropna()
# Simpan hasilnya ke file baru (opsional)
df_cleaned.to_csv("data_cleaned.csv", index=False)
# Info sebelum dan sesudah
print(f"Jumlah baris sebelum dibersihkan: {len(df)}")
print(f"Jumlah baris setelah dibersihkan: {len(df_cleaned)}")
Jumlah baris sebelum dibersihkan: 418
Jumlah baris setelah dibersihkan: 276
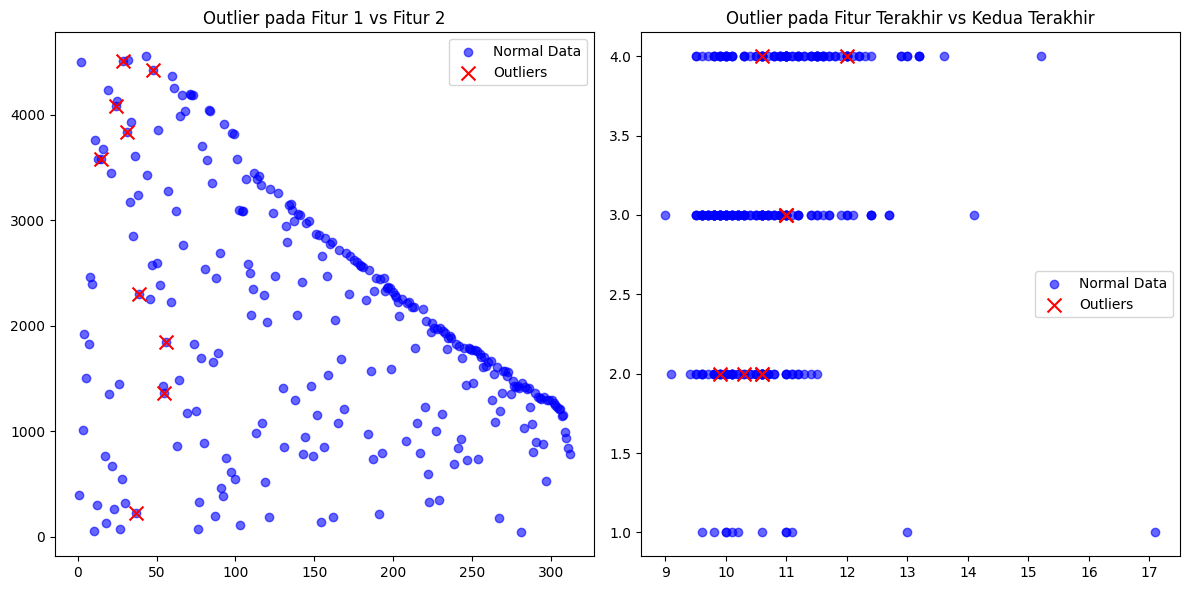
Mendeteksi Outlier dengan KNN#
import pandas as pd
import numpy as np
import matplotlib.pyplot as plt
from sklearn.neighbors import NearestNeighbors
# Load dataset
file_path = "data_cleaned_formatted.xlsx"
df = pd.read_excel(file_path)
# Simpan kolom ID jika ada
id_column = df['id'] if 'id' in df.columns else None
# Ambil hanya kolom numerik (dan drop 'id' dari analisis jika ada)
df_numeric = df.select_dtypes(include=['number'])
if 'id' in df_numeric.columns:
df_numeric = df_numeric.drop(columns=['id'])
# Konversi semua kolom ke numerik (kalau masih ada string yang nyelip)
df_numeric = df_numeric.apply(pd.to_numeric, errors='coerce')
# Hapus baris yang mengandung nilai NaN
df_numeric_clean = df_numeric.dropna()
# Simpan index asli dari baris yang bersih
clean_index = df_numeric_clean.index
# Ubah menjadi array untuk KNN
X = df_numeric_clean.values
# KNN Outlier Detection
knn = NearestNeighbors(n_neighbors=3)
knn.fit(X)
# Hitung jarak ke tetangga terdekat
distances_knn, _ = knn.kneighbors(X)
mean_knn_distances = np.mean(distances_knn[:, 1:], axis=1)
# Tentukan threshold untuk outlier
threshold_knn = np.mean(mean_knn_distances) + 2.5 * np.std(mean_knn_distances)
outliers_knn = np.where(mean_knn_distances > threshold_knn)[0]
# Buat array penanda outlier untuk seluruh data
is_outlier_flags = np.full(df.shape[0], False)
is_outlier_flags[clean_index[outliers_knn]] = True
# Tambahkan ke DataFrame asli
df['is_outlier'] = is_outlier_flags
# Simpan ke Excel
df.to_excel("data_with_outliers_flag.xlsx", index=False)
# Tampilkan hasil
print("\n=== Outlier Detection Result ===")
if id_column is not None:
outlier_ids = id_column.iloc[clean_index[outliers_knn]].values
print(f"ID Outlier terdeteksi: {outlier_ids}")
else:
print(f"Outlier terdeteksi (index): {clean_index[outliers_knn].tolist()}")
# Statistik tambahan
jumlah_outlier = np.sum(is_outlier_flags)
total_data = len(df)
persentase_outlier = jumlah_outlier / total_data * 100
print(f"\nJumlah Outlier: {jumlah_outlier} dari {total_data} baris data ({persentase_outlier:.2f}%)")
# Visualisasi (pakai dua fitur pertama dan terakhir jika kolom > 2)
if X.shape[1] >= 4:
fig, axs = plt.subplots(1, 2, figsize=(12, 6))
axs[0].scatter(X[:, 0], X[:, 1], label='Normal Data', color='blue', alpha=0.6)
axs[0].scatter(X[outliers_knn, 0], X[outliers_knn, 1], label='Outliers', color='red', marker='x', s=100)
axs[0].set_title('Outlier pada Fitur 1 vs Fitur 2')
axs[0].legend()
axs[1].scatter(X[:, -2], X[:, -1], label='Normal Data', color='blue', alpha=0.6)
axs[1].scatter(X[outliers_knn, -2], X[outliers_knn, -1], label='Outliers', color='red', marker='x', s=100)
axs[1].set_title('Outlier pada Fitur Terakhir vs Kedua Terakhir')
axs[1].legend()
plt.tight_layout()
plt.show()
else:
print("Tidak cukup fitur numerik untuk visualisasi 2D.")
=== Outlier Detection Result ===
Outlier terdeteksi (index): [12, 21, 26, 28, 34, 36, 41, 46, 47]
Jumlah Outlier: 9 dari 276 baris data (3.26%)
Klasifikasi Naive Bayes#
Pada data ini model klasifikasi Naive Bayes untuk memprediksi kelangsungan hidup pasien sirosis hati atau memprediksi apakah seorang pasien akan bertahan hidup atau tidak berdasarkan sejumlah fitur medis.
Menghapus data outlier Karena Mempengaruhi Akurasi Model#
%pip install openpyxl
Requirement already satisfied: openpyxl in /home/codespace/.python/current/lib/python3.12/site-packages (3.1.5)
Requirement already satisfied: et-xmlfile in /home/codespace/.python/current/lib/python3.12/site-packages (from openpyxl) (2.0.0)
Note: you may need to restart the kernel to use updated packages.
import pandas as pd
# Baca file Excel
df = pd.read_excel("data_with_outliers_flag.xlsx")
# Hapus baris yang merupakan outlier
df_cleaned = df[df['is_outlier'] != True]
# Simpan ke file baru
df_cleaned.to_excel("data_cleaned_no_outliers.xlsx", index=False)
# Step 1: Import library
import pandas as pd
from sklearn.model_selection import LeaveOneOut
from sklearn.naive_bayes import GaussianNB
from sklearn.metrics import classification_report, confusion_matrix, accuracy_score
from sklearn.preprocessing import LabelEncoder
# Step 2: Baca dataset
file_path = 'data_cleaned_no_outliers.xlsx'
df = pd.read_excel(file_path)
# Step 3: Buang baris dengan Status 'CL' (transplantasi)
df = df[df['Status'].isin(['C', 'D'])]
# Step 4: Ubah Status: 'D' → 0 (meninggal), 'C' → 1 (hidup)
df['Status'] = df['Status'].map({'D': 0, 'C': 1})
# Step 5: Hapus kolom ID & baris kosong
df = df.drop(columns=[col for col in ['ID'] if col in df.columns])
df = df.dropna()
# Step 6: Encode kolom kategorikal
cat_cols = df.select_dtypes(include=['object']).columns
for col in cat_cols:
df[col] = LabelEncoder().fit_transform(df[col].astype(str))
# Step 7: Pisahkan fitur dan label
X = df.drop(columns=['Status'])
y = df['Status']
# Step 8: Inisialisasi Leave-One-Out dan model
loo = LeaveOneOut()
model = GaussianNB()
# Step 9: Simpan hasil evaluasi
y_true = []
y_pred = []
# Step 10: Lakukan LOO-CV
for train_index, test_index in loo.split(X):
X_train, X_test = X.iloc[train_index], X.iloc[test_index]
y_train, y_test = y.iloc[train_index], y.iloc[test_index]
model.fit(X_train, y_train)
y_pred_single = model.predict(X_test)
y_pred.append(y_pred_single[0])
y_true.append(y_test)
# Step 11: Evaluasi hasil
print("Confusion Matrix:\n", confusion_matrix(y_true, y_pred))
print("\nClassification Report:\n", classification_report(y_true, y_pred, target_names=["Meninggal", "Hidup"]))
print("\nAkurasi: ", accuracy_score(y_true, y_pred))
Confusion Matrix:
[[ 65 39]
[ 14 131]]
Classification Report:
precision recall f1-score support
Meninggal 0.82 0.62 0.71 104
Hidup 0.77 0.90 0.83 145
accuracy 0.79 249
macro avg 0.80 0.76 0.77 249
weighted avg 0.79 0.79 0.78 249
Akurasi: 0.7871485943775101